The failure everyone ignores
At some point every developer has stared at a CI failure that disappears on retry and decided to just move on. I did that a few too many times before it started bothering me enough to think about it properly.
The problem is not that flaky tests exist. The problem is that there is no good way to prove a test is flaky versus genuinely broken, and no easy way to find the worst offenders in a large suite. The usual workflow is: test fails, someone reruns it, it passes, everyone forgets.
Over time that accumulates into a suite nobody trusts. Red stops meaning "something is broken" and starts meaning "probably nothing." That is a bad place for a team to be.
Designing the autopsy
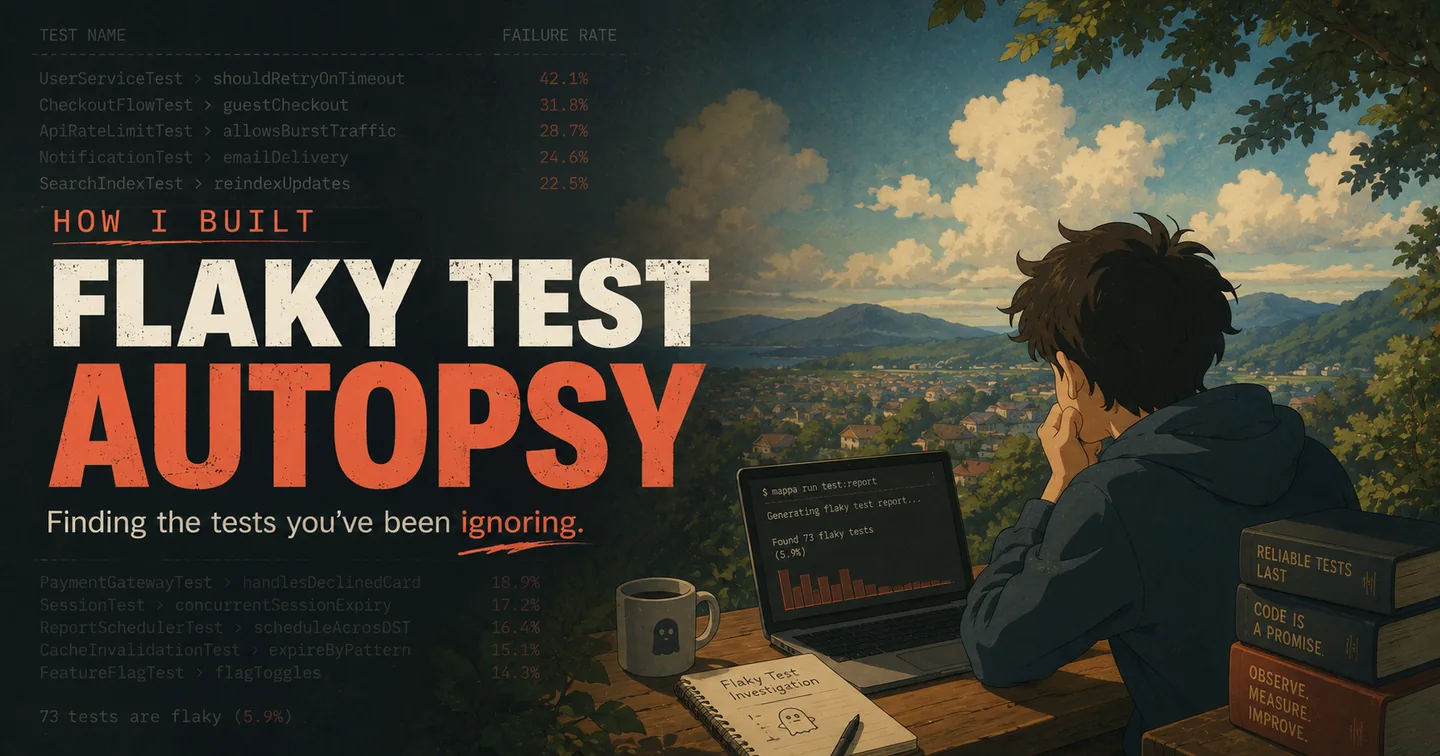
I wanted a tool that gives you evidence, not vibes. Not "this test failed once" but "this test has a 12% failure rate across 50 runs, and it always fails within the first 200ms." That specificity matters: a race condition and a flaky network mock look very different once you have timing data.
The interface had to be boring on purpose. Point it at a test directory, tell it how many runs to do, get back a ranked list of unstable tests with enough context to start debugging. No config file, no setup ceremony.
$ pip install flaky-test-autopsy
$ flaky analyze tests/ --runs 50

CRITICAL  test_payment_retry      24% fail · 50 runs
CRITICAL  test_socket_teardown    21% fail · 50 runs
WARNING   test_cache_expiry        8% fail · 50 runs
noise     3 tests under 5%, full report below
Building the engine
The core loop is simple: run the suite N times, collect pass/fail and timing per test, compute failure rates and variance. The hard part is doing that without the tool becoming the bottleneck, so parallel execution with a configurable worker count went in early.
Parsing test output was the most tedious piece. Different runners produce different formats, and I wanted pytest, unittest, and Jest to work without any configuration. The fix was a small parser layer that detects the runner from the output structure instead of asking the user, removing a setup step most people would have gotten wrong anyway.
The output went through several iterations before landing on severity tiers: over 20% failure rate is critical, 5 to 20% is a warning, under 5% is noise. Most of the time the critical list is short, and that is exactly where you want to start.

Shipping it to PyPI
I had pushed code to GitHub plenty of times but never to a package registry. The mechanics of PyPI are not hard once you untangle the tooling, though I spent an embarrassing amount of time on the difference between setup.py, setup.cfg, and pyproject.toml. The ecosystem has gone through several generations of tools and the documentation reflects all of them at once.
The final pipeline is clean: pyproject.toml with Hatch as the build backend, and a tag push triggers GitHub Actions to test, build the wheel, and upload to PyPI. The first end-to-end release felt more real than any repo push has.
The README was the other thing I underestimated. Explaining installation is easy. Helping someone decide in one paragraph whether this tool solves their problem is hard. I rewrote the opening three times.
$ git tag v0.3.0 && git push --tags

→ GitHub Actions
✓ tests passed
✓ wheel built
✓ published to PyPI
What it found, what's next
The tool has already caught three tests in my own projects that I had been quietly excusing for months. That alone paid for the build.
Next on the list: a JSON output mode so teams can pipe results into their own dashboards and CI gates, and a cleanup of the parallel execution internals, which work but are messier than the rest of the codebase deserves.